• General
  • Raster, contour and vector data

I wanted to start a topic to maybe give some ideas, how the raster, contour and vector data may be used and combined, and maybe other users will also relate to this and share their own ideas and also - maybe this will be useful for Paul to later share teasers with actual data. 🙂

So, the current WSV3 generation (e.g. V5.10) does not support adding contours for example to temperature parameter. As Paul explained to me - there is plan to make it available in this new generation, so I started a topic. Below I added few examples of how it may be used.

For example 1.image - precipitation intensity with contours. I think it better visualizes where the strongest value areas are - for example you may use colors for e.g. 0.1, 0.2, 0,3in, etc., but also add contours, with step 1.0, 2.0, 3.0in, etc., so it gives smooth look at raster fill, but at same time makes better look for the important value steps. Also it will make better to already tell what values are present. I think this idea with contours and labells was already presented at V6.0 BETA.

Great thread. Yes, the V6P experimental MSLP-only contour line labeling algorithm is something that will be extended to a generic raster data contour line mode. I have a couple ideas here; one of them involves using the same color palette format to specify both colorization and contour lines. Broadcast systems have a feature where screenspace-width borders between color levels can be defined, which is essentially equivalent to colored contour lines on top of a fixed-scale color palette with hard edges. Haven't formalized this yet very much, but I am planning on making the elevation hypsometric tinting in the mapping engine the first enactment of the generic "raster display engine" for the next-generation WSV3. I would like the default mapping to automatically display elevation contour lines on close zooms, and this can be the same exact general raster display engine as real-time raster weather data layers. Currently, the terrain (i.e. 3D heightmapped raster) aspects of the new mapping engine have attained a good initial implementation, and as of the last two weeks I have crossed-over into the vector rendering (GIS lines) aspect. This will likely be a few months and overlap with labeling - then, when the time is right, I will return to the raster aspect and implement a generic contour line, contour line labeling, color palette, color palette editing, probe point, extrema labeling, etc system (like in V6P) with initial introductory development application to the terrain elevation data.

    Paul

    1. Yes, I really like the idea, that you can for example select product and then assign color pallete for both raster fill and contour data. In the 1st image I added example of pure contour colored lines and in 2nd image - raster fill below. I think it creates very eye-candy view and better makes out the isobars, and additionally the contour labells will play huge role. For example when viewing not only pressure, but let's say temperature - it creates good contrast between each value (best shown in 3rd image).


    I also tought about the color pallete editor that you already showed and I had idea. For example if you now want smooth or hard-edge (solid) color pallete, you need to manually adjust each value in the text editor, but I think it would be great, if it would be possible, for example to create a basic color pallete with some colors, that by default would be smooth type, and then in application in that color pallete editor, there would be option to select either smooth or hard-edge (solid) step value. Additionally there may be option for intervals - for example every 1°F, 3°F etc., so the pallete editor would automatically make the pallete solid with steps, with the defined interval. I think you already mentioned that idea, but I just refresh it once more. 🙂 In the image it is just one example of how it may look (found on web).

      MeteoLatvia It's not premature to start talking about the specifics of the operational color palette editor. I need to hit an ABSOLUTE home-run in this area as it is the most well-known, talked-about, and impactful visual customization.

      First off let me announce that I have a goal where, with the new floating licensing system and everything revolving around data subscriptions, all user customizations can be automatically synchronized to your web subscription account and seamlessly synchronized on cross-device usage. So, perhaps a library of custom user palettes and specific maps. There can even be a Twitter-like "map share" global feed where users upload their content in a social-media-like fashion.

      In order to build something like this, I have to keep things simple and compact. Starting with color palette customization only is a great idea. I will probably do the color palette editor, palette library, auto-synchronization, etc first and then only return very late in the project to do all other customizations. This can be the initial case for creating the general map customization system.

      Now, I have to decide between various ways of organizing palettes and styles. What I want to do is get away from the old model:

      1. One big bucket of all color palettes, not organized by unit, associated parameter, or ranges
      2. A bunch of fractured, separate raster layers each having a text/string variable matching to the name of a color palette.

      This is very bad. For starters, if I were to implement the videogame-like "fileshare" system I discussed above but with weather maps, this would require uploading and duplicating all user palettes.

      Instead there should only be a narrow slot of active color palettes, or perhaps one fixed "palette set" object that contains up to 32 palettes, and the specific content of your map refers into "Palette 1", "Palette 2", etc as different slots in this "palette set". So the only thing that needs to be stored and uploaded with sharing your custom map is a temporary map of color palettes.

      Then, there can be a large library of custom palettes on your disk that you use to insert into the current "active palette set". This removes the terrible aspect of having a text-based lookup for each layer into a large local database. I hope this makes sense. This could work a few different ways - maybe we separate the colors themselves, and the associated unit/range values/contour line settings, into different concepts/objects. After all, the same set of colors can be useful for very different products having very different numerical ranges. Have to think of a flexible, versatile, simple, user-friendly, and powerful logic for breaking down these options and concepts.

      Here is how I described this idea in an email to a colleague:

      Color palette data loss thoughts: My future remedy is the convenient restructuring of how the next-gen product handles resources/user files. I want one very lightweight directory that has only user customizations such as palettes, and another cross-user directory that stores static resources such as downloaded mapping data. I'm also moving towards embracing groups of things vs files in isolation, e.g., a file for "Paul's palette collection #1" which contains a group of palettes. Better organization like this will prevent such further occurrences.

      In fact, with the floating cross-device licensing, my ambition is to make the user data so lightweight we can upload it automatically to a web account and give users seamless cross-device remote sync and backup of weather maps/views, including settings such a color palettes. I am inspired by what Bungie did with the Halo 3 video game in the 2007 - 2010 era with something called "theater mode". Players could record portions of multiplayer games and later render them on Bungie.net servers as video clips or screenshots. WSV3 could have a "saved maps" and "saved charts" system that unifies data appearance settings and loaded data layers, giving the option to share maps with others or keep them synced on your private account for cross-device usage. An enterprise service could eventually offer automated server-side rendering of saved maps for industrial automated graphics, similar in concept to the Halo 3 video game online fileshare/theater system.

      All this is a little different from your comment on the editor itself, so let me progress to that.

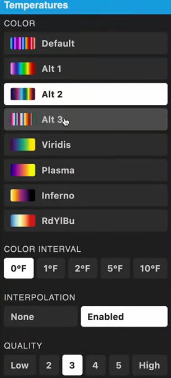
      So, I definitely think it's a great idea to have embedded functionality in the color palette editor to aid convenience beyond a general RGBA + numerical value list/array editor.

      The way I want the color palette editor to work for both SDF graphical palettes (like text font colorization) and also weather data will likely require a built-in "contour" feature within the palette editor itself. So, you could specify that certain steps are hard or smooth like you say, but ideally the "smooth" option is defined as a normalized screenspace pixel width. This is ambitious and might be difficult to develop. I am starting to talk about things I haven't really done a lot of work researching yet, but let's think about ways like this to unify the contour and raster color palette rendering.

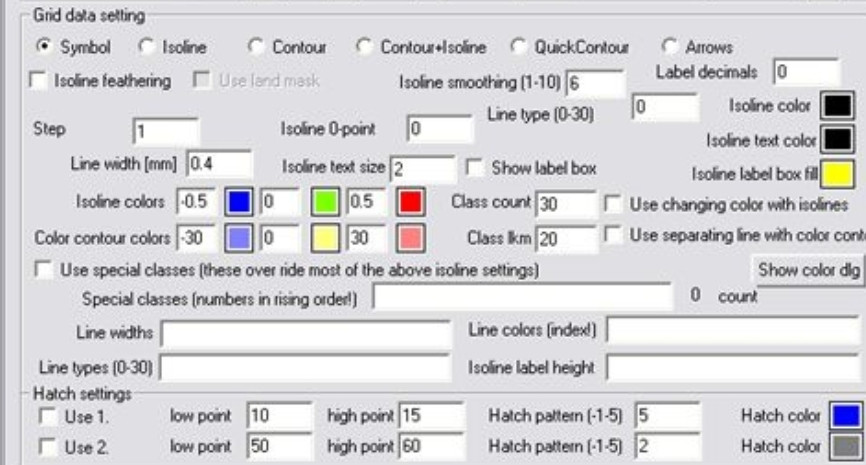
      Question: would you ever need to have a separate color palette for the color fill and the contour lines? Maybe there could be two contour modes:

      1. Mode 1 - manual palette contours (contour levels and colors are manually determined by a palette specifying them)
      2. Made 2 - automatic palette contours (user specifies one fixed contour color and one "interval" parameter)

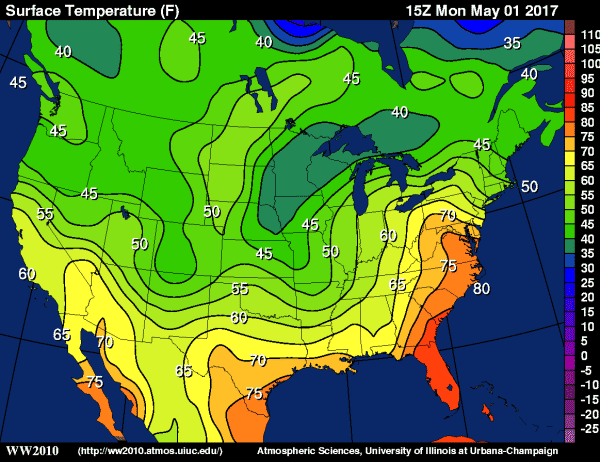
      Maybe variations on Mode 2 could introduce a high and low color. I also want to have ability for dynamic scaling based on current map view dataset extrema values (first-generation does this in the terrain mapping hypsometric tinting - it scales the palette ranges according to changes in view max elevation). That is actually a really cool feature and shame it is confined to the terrain colors. It would be very useful as a general raster display ability. That is, by default, a dynamic scale color palette would get a basic visual going regardless of the values of the underlying dataset. This then facilitates interactive development of a fixed-range palette for the given data product.

      This post is more of a stream of consciousness and less of a specific proposal, since I am still digesting these concepts. Let me know if anything I've said makes sense or causes you to opine one way or another. I will develop a really great solution around all these concepts.

        Paul

        Thank you for such a great and detailed explanation! 🙂

        The idea of the user customised data synchronisation with the web subscription would be absolute game changer!!! Totally awesome! It would be so super nice, to have all your data saved, rather than trying to save it manually and then still losing some important palletes I needed on my PC storage. 😃

        About the color palletes and their storing options. I definetly would go with as you said "fractured, seperate raster layers each having a text/string variable". If I understood correctly I had even deeper idea of creating some sort of choice to organize color palletes by parameter type. So for example you have "temperature palletes" folder, where you save all palletes for temperature parameter and then you can just select that parameter from program and then you can select specifically color palletes you have assigned for temperature parameter folder, so you don't have to go trough all color palletes you have. The problem arised - you may have different temperature parameters, like 2m Temperature, 850 mb Temperature, 500 mb Temperature etc., but with that I had another idea:

        Maybe it is possible to develop pressure level selector, so user can select it directly in program. The idea was, that right now we have to create seperate parameters for diffrent pressure levels. For example as I said 850 mb Temperature, 500 mb Temperature etc., but with pressure level you can already have predefined options, that are available for example in model GRIB directory and select it. I don't know how hard it will be to tehnically do it, but I saw that idea being used in my local weather service.

        About the "saved maps" system - that would be amazing thing too, that is also used here in weather service. In here we have the graphics system which uses so called "User presets", because on one computer, as many as 5 meteorologists can work. Each one has their own preference of data styles etc., so with 1 click it loads their own customized map, that already has predefined everything (color palletes, map style etc.). In WSV3 case - that would be awesome thing to have, because users can share their configurations maybe? A lot of possibilities.

        Talking about the color pallete editor - I think it still be needed to have option to change colors for raster fill and contours seperatly. I have attached image from the weather workstation we use here and this is the data visual customization window. Few things that caught my eye:

        1. If you look at top there is grid data setting option. You can select many options, but we can narrow it down to raster fill and contours. What I tought - maybe there could be something similliar, maybe checkboxes can be added to select both raster fill and contours? Oh, and another thing - there may be also thing that is like text based values that shows on map like in grid. I don't know how they are really called but they are also availble in current WSV3 product under vector data.

        2. There is also option to manually choose smoothing for contour lines. That may not be very useful (in my opinion) as many users will prefer smoothed option always. Also it then has option to further customize contour labels etc.

        3. And here is the thing you mentioned that we can assign min/max values for colors. See the color contour - you select minimum and maximum value and their color and then to the right you can select if it is smoothly interpolated or it has steps, and how big are the increments for the steps. The other settings are not important in our case.

        Everything you said makes full sense and is what I also have tought about. Sorry if I didn't understood something, because I still learn English and I can misunderstand some things. 🙂