Paul Thank you so much for the reply!
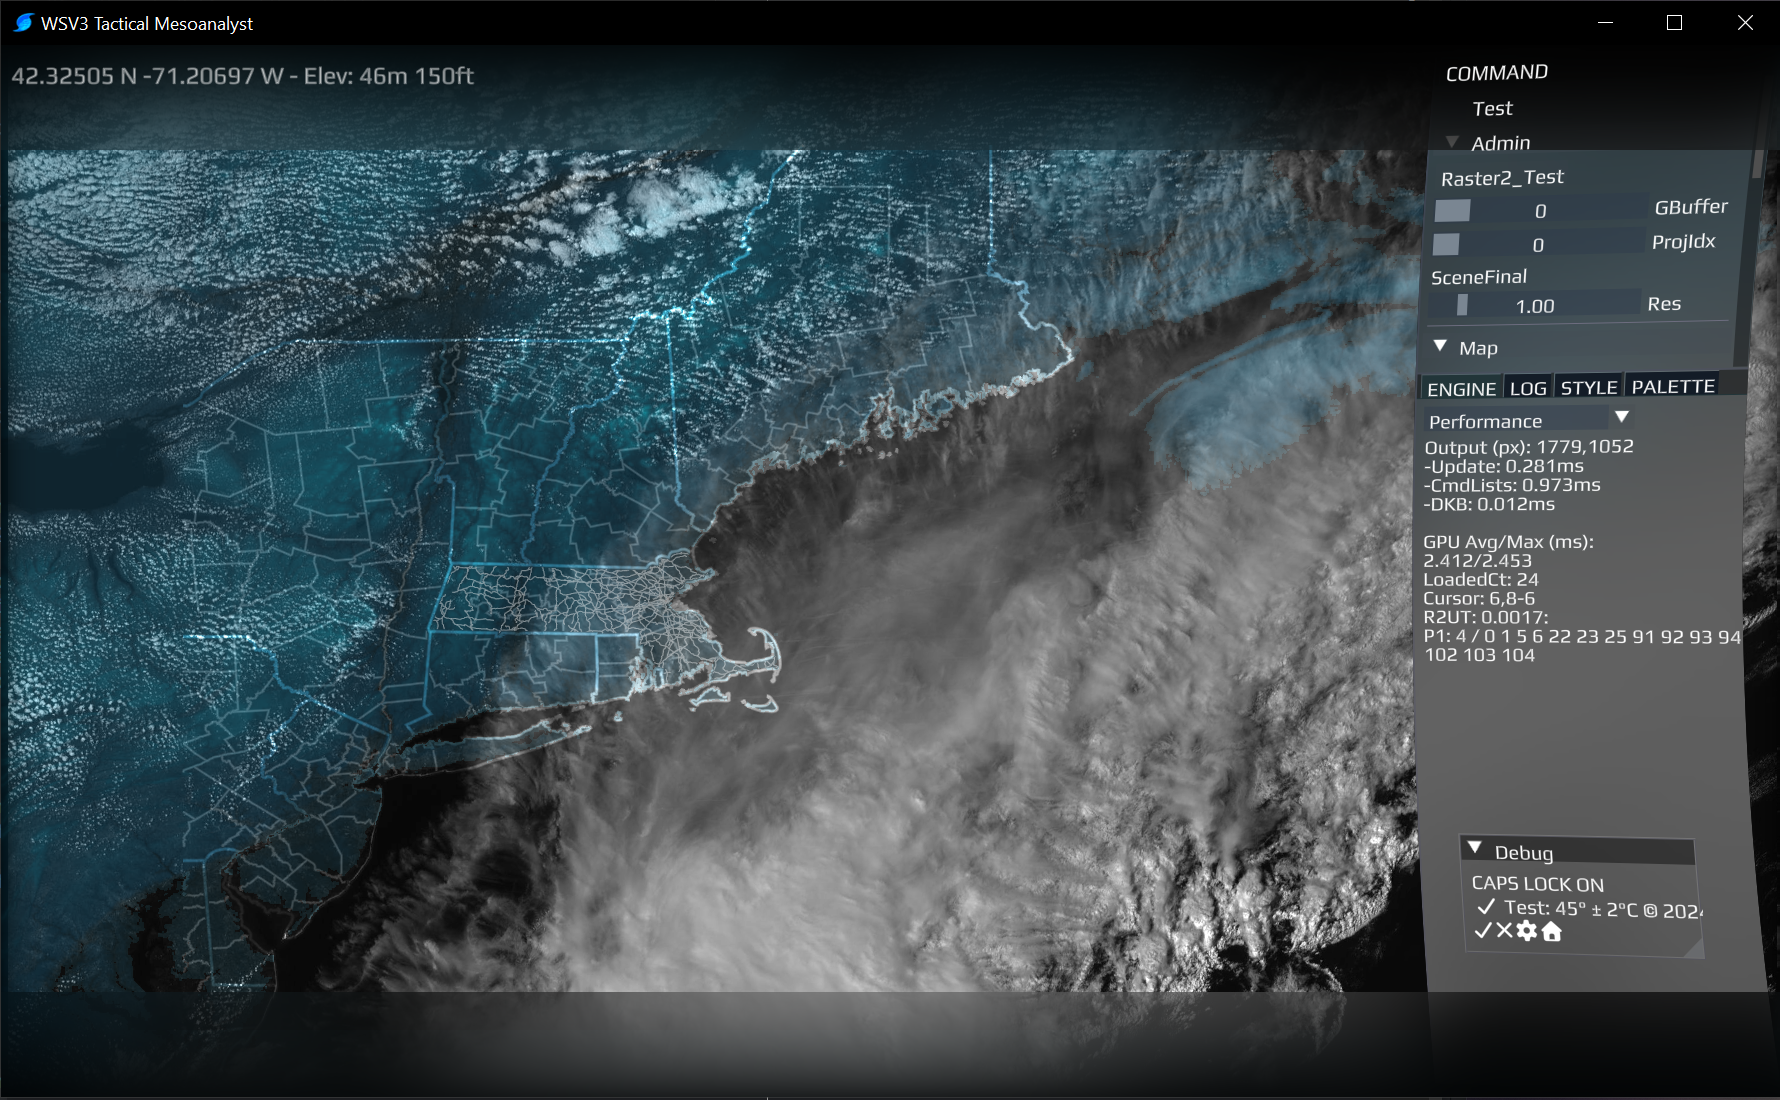
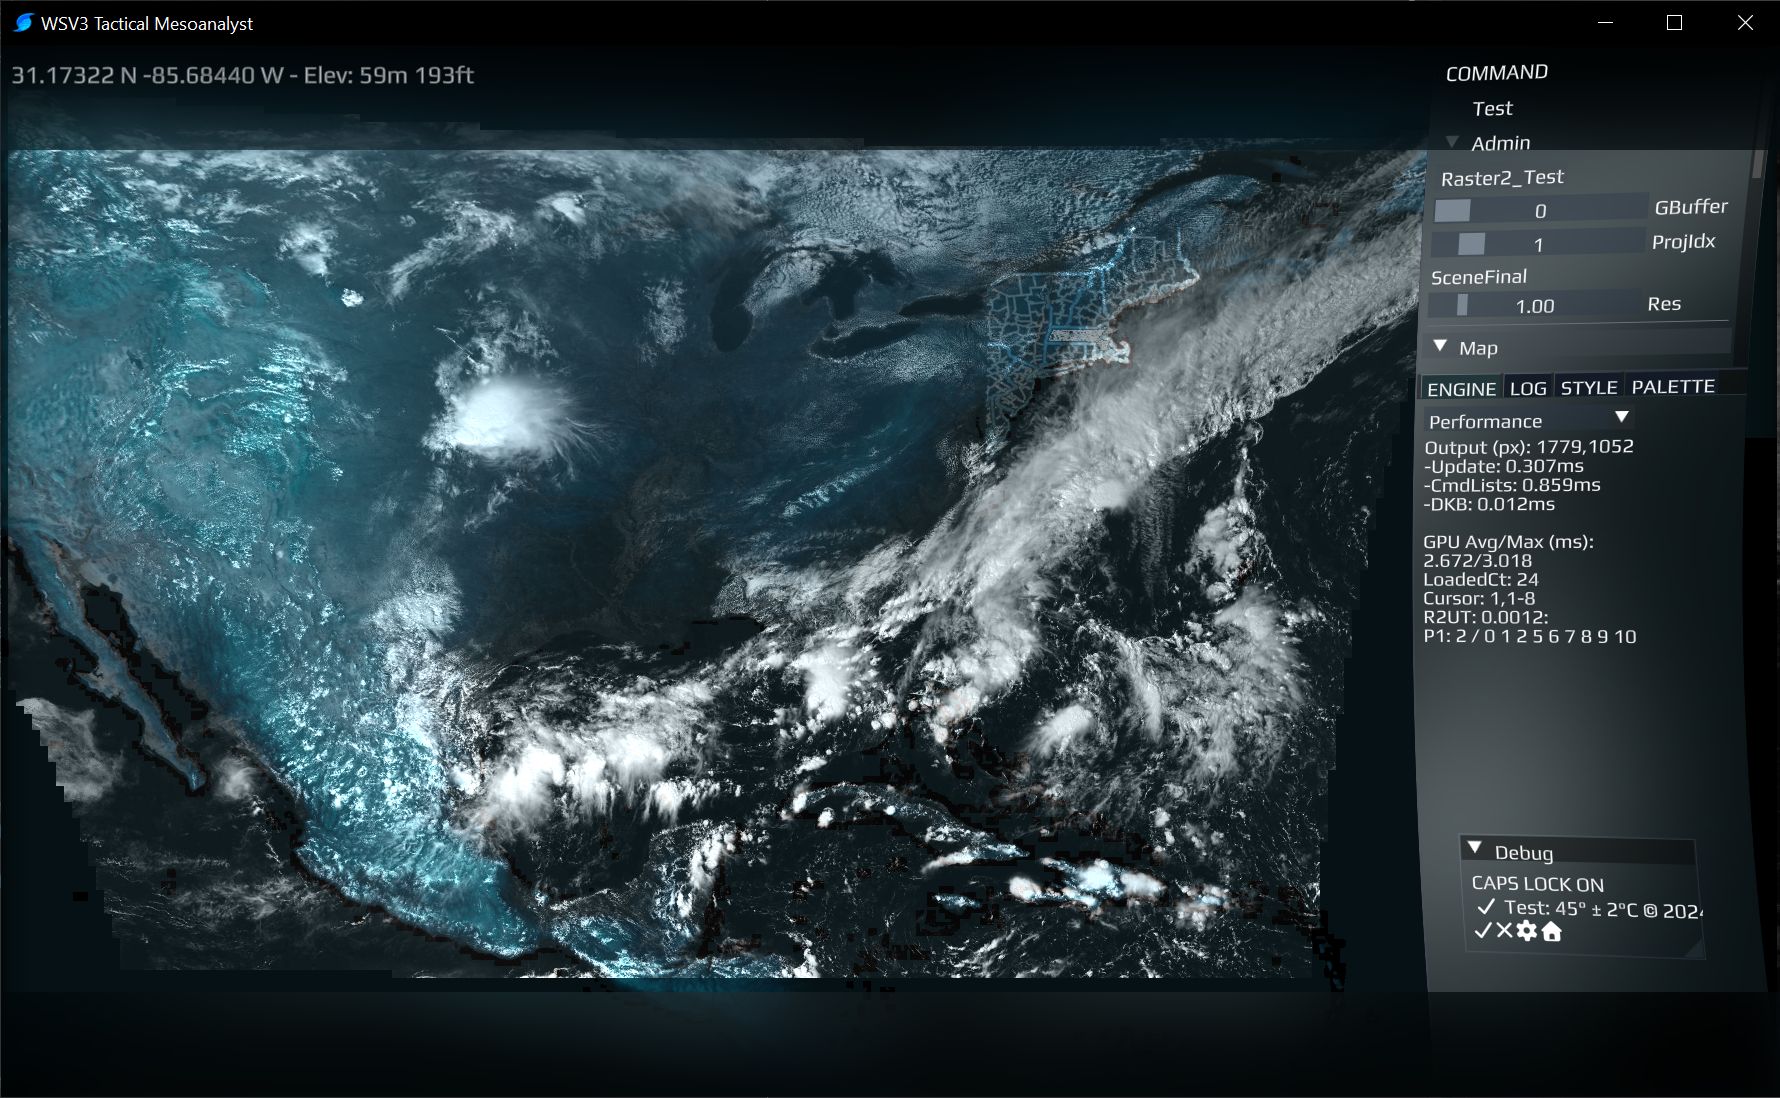
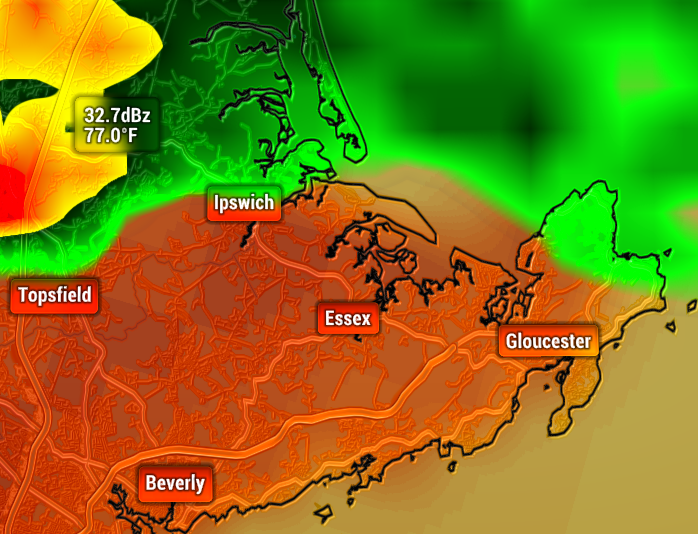
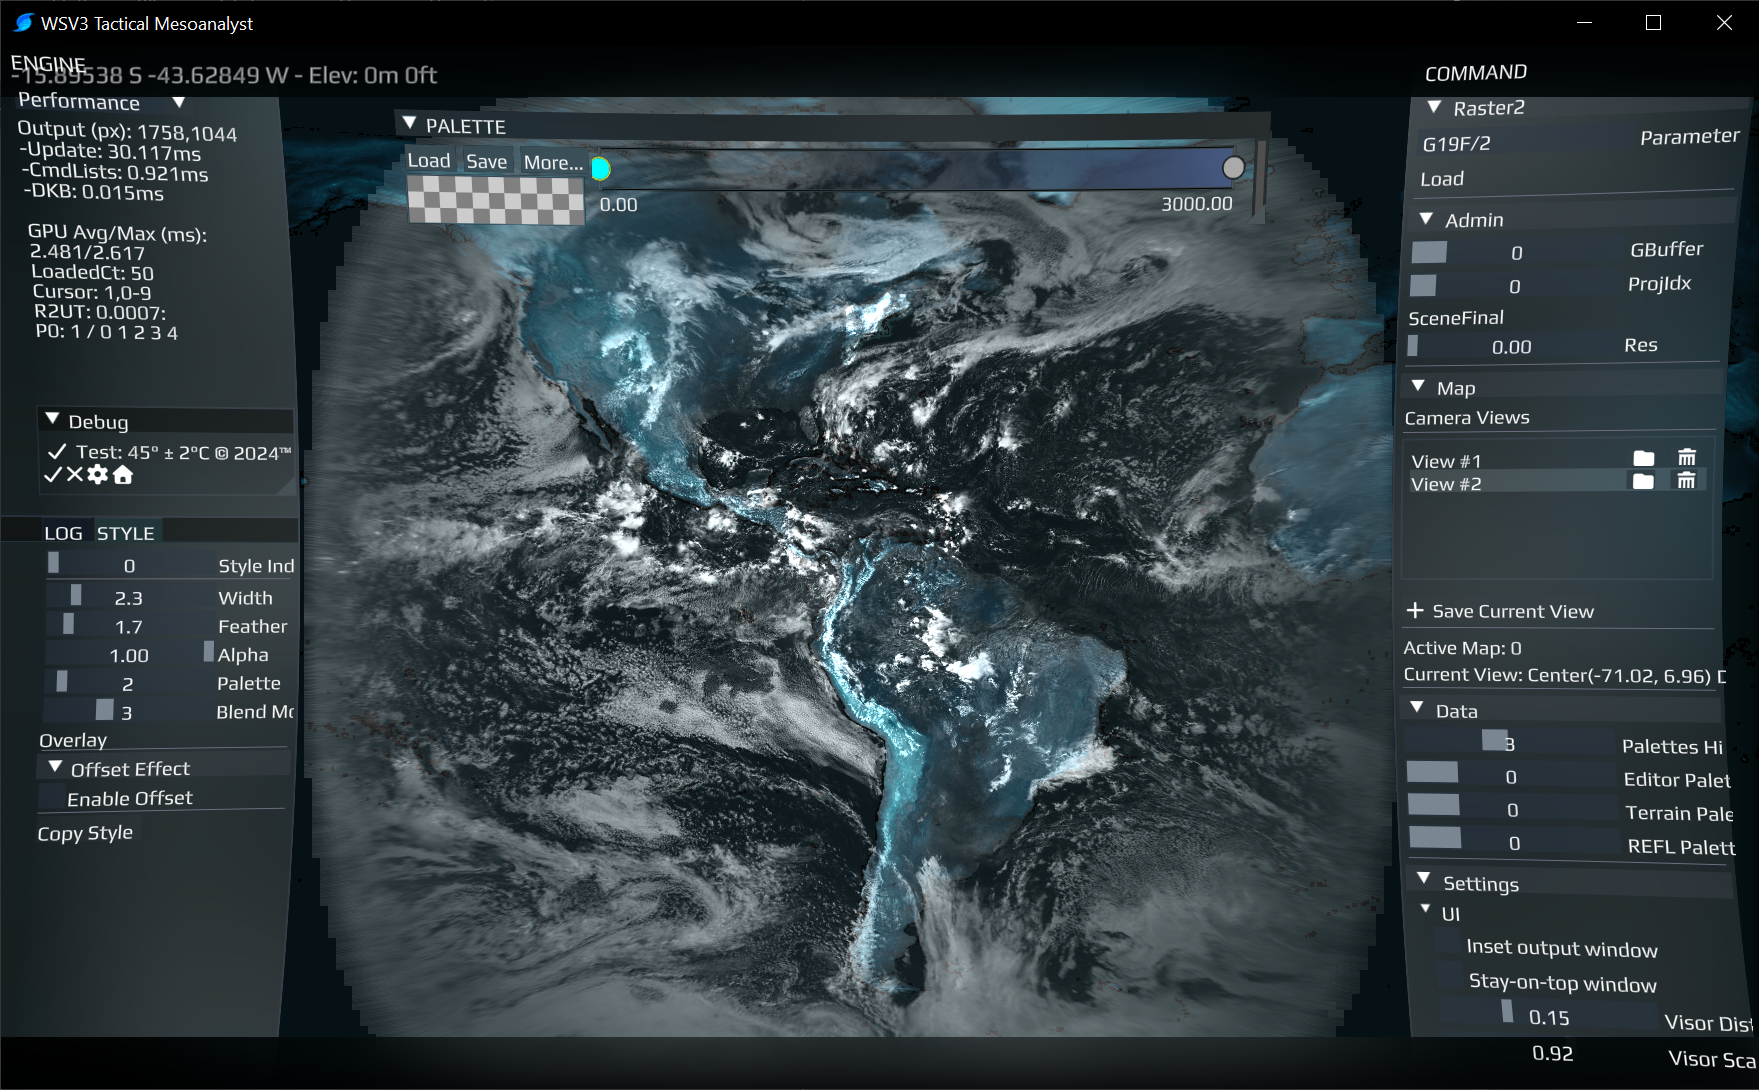
Yes, unfortunately, EUMETSAT still does not share the GEO satellite data in the S3 bucket (although there is a chance to access that, but only through paid licenses that European NWS and government agencies most often obtain). But the mentioned "EUMDAC" API / CLI is the only official, free option to use. For GEO (Meteosat-12), it allows for raw NetCDF file download. I use it myself when I need to quickly and programmatically access satellite data from both GEO and LEO (e.g., NOAA-21, Suomi-NPP) satellites and then do the calculations with "R" and plotting with "Python". I have also automated the image generation process, so it generates native, full-resolution images in geostationary projection and outputs them in whatever format I need (.png, .jpg, .tiff), and then I hooked it up to WMS, for example:
WebUI: https://view.eumetsat.int/productviewer?v=default
WMS: https://view.eumetsat.int/geoserver/wms?service=WMS&version=1.3.0&request=GetCapabilities
I am a complete dunce at software development, so I can just imagine that it significantly differs from plain Python code, but maybe the "EUMDAC" can give the first breath until we have any news of "European Weather Cloud" and their S3 buckets (with EUMETSAT data) becoming freely accessible for everyone, but there are no current intentions for that as far as I know.
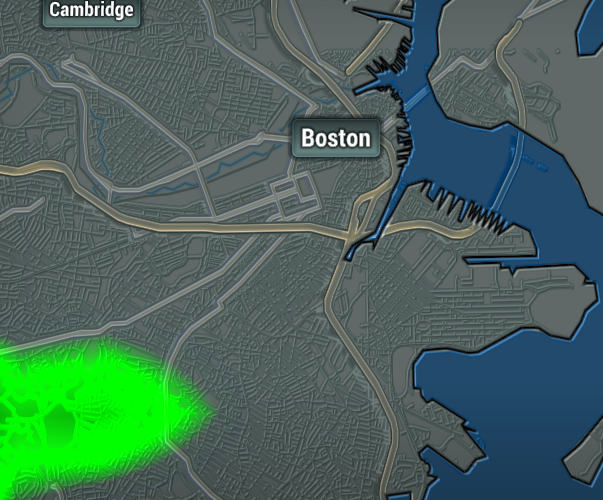
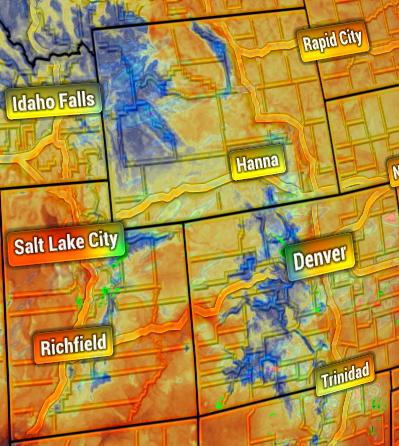
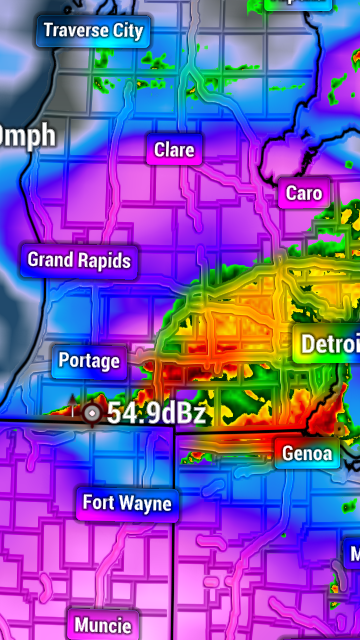
Paul I'm particularly excited about the precipitation rate product, as that is sorta like having radar over all of Brazil.
Yes, this is a very exciting product we have developed. This belongs to the L2 data processing level, and there are also other derived products from the GEO satellite (Meteosat-12), like the lifted index, cloud analysis, fire detection, sky radiances, overshooting top detection, and classification, etc.
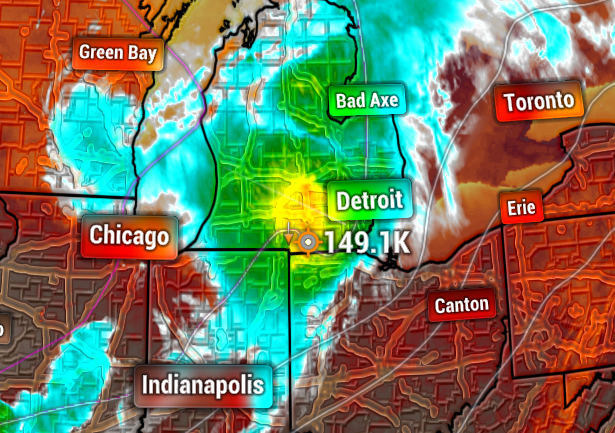
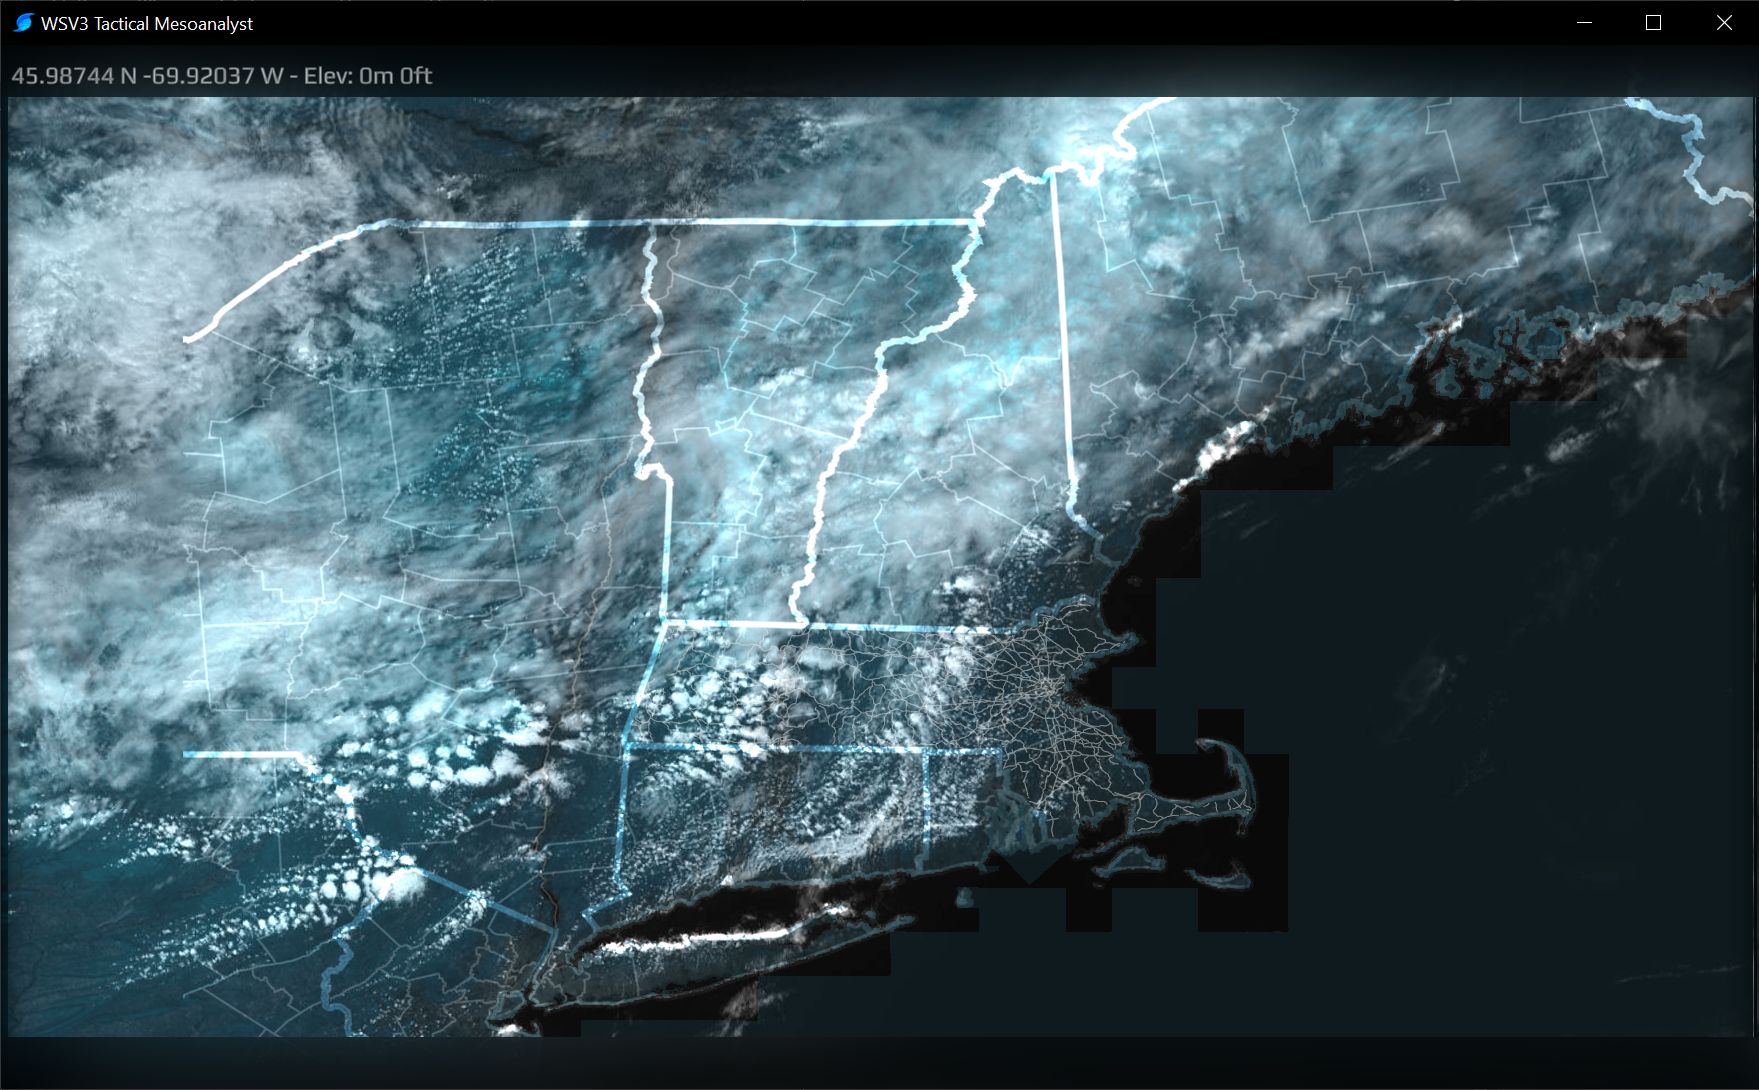
Paul I just saw on their web page you linked, they have a rapid scan special domain like GOES.
Exactly, we already have the so-called "Rapid scanning service" that is hosted by a separate satellite, and it covers the upper quarter of the disc service. For our next-generation GEO satellite system, this mission will be done by MTG-I2 (Meteosat-14), which will be launched next year and become operational by the end of 2026, and provide the exact same imagery as MTG-I1 (Meteosat-12) for a full disc instead of 10-minute repeat cycles every 2.5 minutes. Here you can see the disc section I am speaking about
And in case you just want to see it for yourself, here is the full documentation of the European geostationary meteorological satellite data format and technical details: https://user.eumetsat.int/resources/user-guides/mtg-fci-level-1c-data-guide
Paul but if I'm not mistaken Europe still has a problem with open source radar data whereas the satellite imagery is better.
Yes, right now, only 12 countries in Europe share their full radar volumes in real time through the API, but by the end of this year and early 2026, the open data access project called "RODEO" will make its tool "MeteoGate" operational. It will centralize the raw full volume data from all European weather radars in one place for easy access for each radar site separately. The same will happen with all SYNOP observations and weather warning polygons. If you do not mind, I can keep you updated with this as we approach the final phase of API integration and documentation.
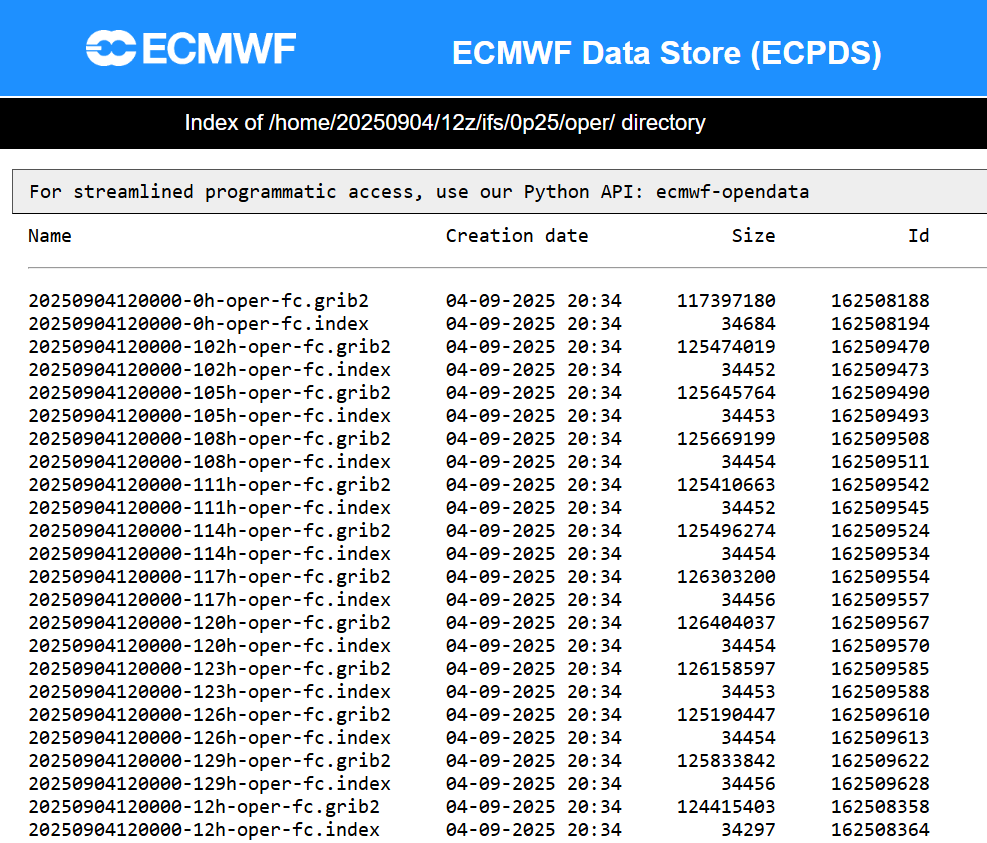
The aforementioned could effectively solve all the lack of data over the European region we had, because now we would have high-resolution, GOES-like satellite imagery every 2.5 minutes, then every single radar station with the full data volumes every 5 minutes, and a resolution of at least 500 meters (most of the radars in the EU are dual-pol, C-band radars, some of the latest ones have SSPA capability and most do full volumes in at least 5 minutes with 500 m resolution, but quite many also have 2.5 min full volume scans at 200-300m resolution). All the SYNOP station data (for each station separately) would be available too, with a cadency of 10 min. Also ECMWF model is now open source in a format that I guess is already accessible by you, Paul (https://data.ecmwf.int/forecasts/), where the data is for every forecast hour separately with GRIB2 and INDEX file, so Europe (and matter of fact the entie globe) would have 9 km NWP that runs 4 times a day (00Z, 06Z, 12Z, 18Z) with extent up to 360H (06Z and 18Z runs up to 144H).
There will also be the release of the so-called "HARMONIE" model, which would run every 3h with a resolution of 2 km and covers Europe specifically (something similar to HRRR, but for Europe).
Apologies for such a long post @Paul , just wanted to give the latest and condensed information on the most critical weather data for Europe and the news about it becoming (and already having it) in an open, open-access, standardized format. Would be happy to discuss this further once you would like. 🙂 And once again - I am very grateful for your work, Paul - you are developing the future of weather data displaying and operational tool that is just miles ahead of any competition already in the development phase, at least it feels like it. My deepest gratitude!