Tim 3D mesoanalysis is going to be one of the foremost trademark distinguishing factors of the next-gen WSV3. I am currently working on a generic 3D raster engine with the ability to overlay/drape arbitrary raster parameters to the terrain itself. This is actually the hard part. Pressure-level-defined fields up in the sky I anticipate to be easier and more performant because they do not need to reference terrain height. In that case, for model data, the projection can use a low-res mesh itself derived from the 500mb height (etc) corresponding model field.

I intend to give the engine the ability not only to render-to-texture these surface terrain-projected fields, but also to separately render fixed height above ground parameters that use true vertical 3D offsetting from the terrain. So, think of a 1km AGL reflectivity field (the MRMS radar for instance) being correctly displayed as a non-flat surface because it varies with ground height.

That case will use the most GPU processing power, but that is OK. 2D mode is fully supported for lightweight map motion. Also, the GPU usage only predominantly occurs when the map is in motion. I am going to build the fullest and most correct 3D spatial visualizations and let the user decide when they want to use GPU power.

I also have a great idea for a highly optimized way for rendering timeseries/animated 3D raster data when the camera is at the same view, which doesn't have to fully re-render the terrain mesh like when moving the camera. The GPU should only experience maximum usage when you are actively moving the camera.

Here is a screenshot of an early experiment on projecting arbitrary raster data to terrain texture.

I happen to be actively resuming work on this area the very last few days, so your thread is very timely.

I have a clear vision for the most essential form of 3D geospatial dataset visualization: colorized raster parameters at different heights/projections. Two other future categories I will probably not tackle until next year are streamline/particle rendering and volume rendering.

Thanks for letting us know Paul, a really exciting future looks ahead!

Tim

As I was reading this, I got all dreamy about streamlines and volumetric rendering, then you smack me back into reality with your final sentence.

I say this very light-heartedly, of course, as I support your mission to do it right and do it the best, not just get it done by release. I have a suspicion that what you are creating—if done fully as you envision, without compromise—stands to put the industry on notice: The bar for excellence in weather visualization has been raised. This is the one to beat. Good luck.

Stay focused and stay the course. Do not rush. Do not compromise your vision. We’ll wait. It’ll be well worth it, for you and for us.

Thanks for taking us along for the ride.

    Kirk I appreciate how you can perceive the development tension I have to face between seeing really cool, really ground-breaking things sooner and of total overall development efficiency for a real-world releasable product. It has required a lot of discipline to do things in the sequential order which minimizes retroactive wasted time. For instance, last month when I completely gutted the traditional VCL/Windows components UI and opted for fast, no-bloat, GPU-renderered, immediate-mode UI for the entire application, that was a major investment in the future but requiring me to take several steps back. I had to recreate the multi-map, dynamic resolution rendering engine with a new immediate mode vs retained API for better performance - basically redoing 6 weeks of work from the fall in 3.

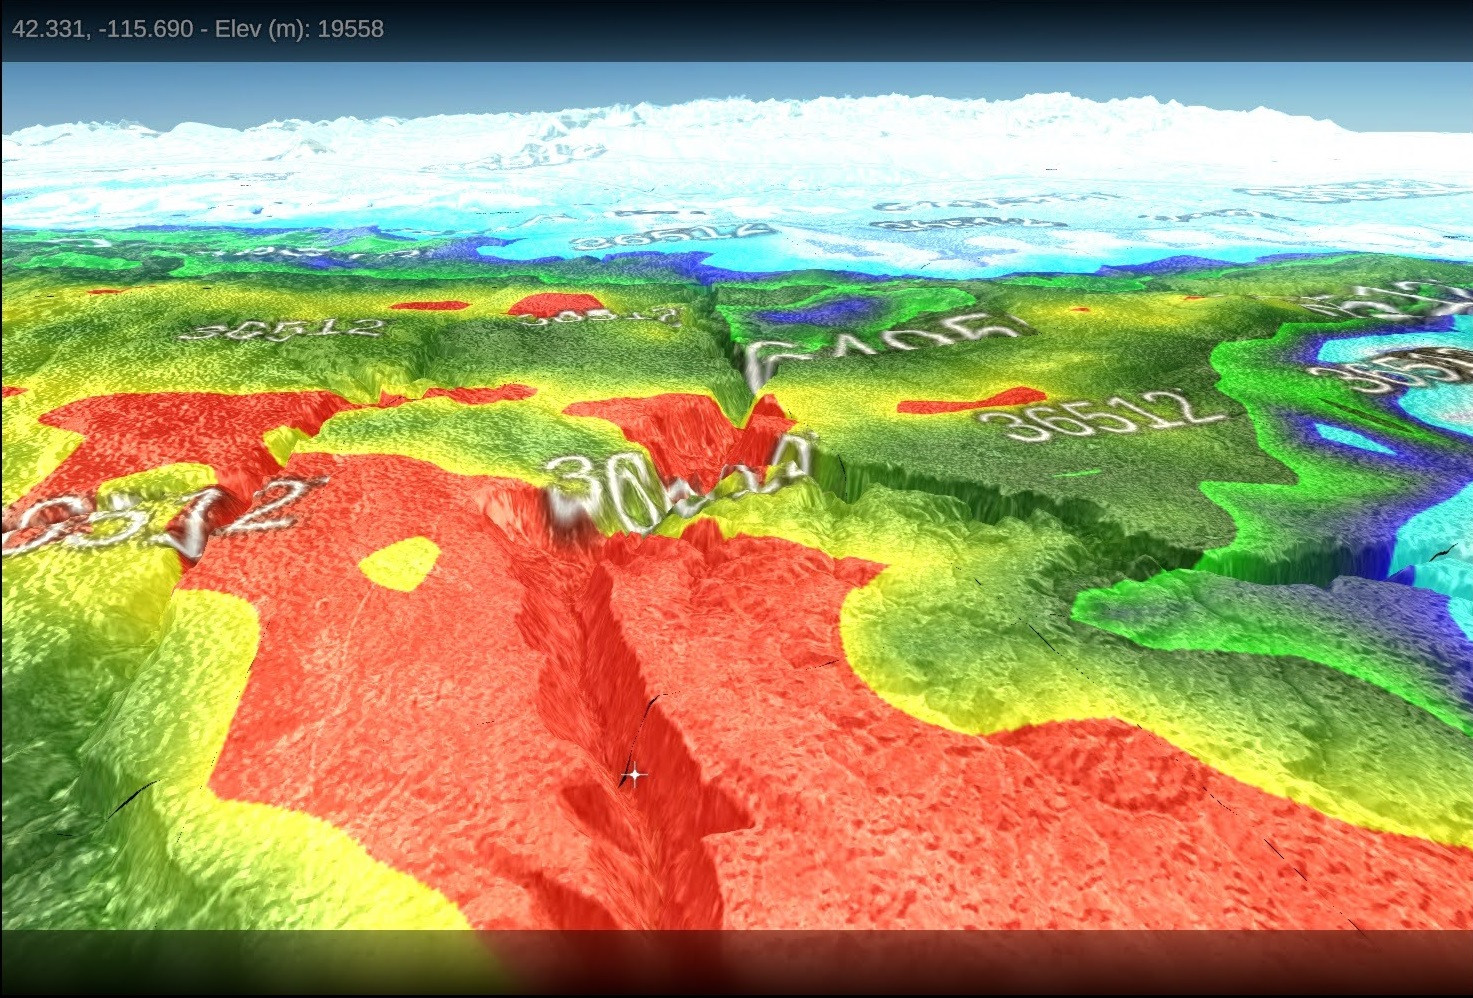
    Another great annoyance you can see is I've had to take a step backwards on the background imagery (the beautiful terrain screenshots from winter) and live with only colorized 3D terrain elevation data because the system I hacked together in January just to get basic 3D terrain imagery up on the map was not satisfactory. In particular it was limited just to that static mapping data, yet in the past two weeks I've designed the release-ready equivalent, which will abstract both real-time generic raster data and also mapping data into the same engine. So it could be next month until I even have that aspect back, but then it will be far more visually impressive, with the ability to blend multiple raster datasets (for the base mapping) and also to display arbitrary weather datasets projected on the terrain with the imagery as well.

    I need to stay the course of correct sequential order because this minimizes waste between now and release in 17 months, and maximizes the content able to be delivered on release.

    There will be a large acceleration in rate of graphically discernible progress after a few more months of low-level engine work. For instance, my work the entire last week has been within non-visual experimental console apps for certain systems to be integrated into client. This is for a deployment system that will blow people away at the immediacy of first time program launch with ZERO installer and seamless invisible automatic background updates like a web browser. The economic rationale for doing something like that now is it makes my development more efficient, because I am testing on multiple PCs including an NVIDIA RTX 4060 laptop, so by doing the boring work first and the exciting work second, the exciting work can happen at a faster rate. I've encountered many cases where something beneficial for myself for testing/development has a direct equivalent to end user convenience, such as not having to go through the hassle of manually downloading/transferring/installing files when wanting to test a new internal build.

    Again thank you so much for sharing my faith in how jaw dropping what we will be looking at in 2025 will be. After the new raster tile ingest/composition system I plan to start in around 2 weeks has some progress, we will have another round of excitement-building screenshots that show the promising power of the new 3D mapping engine.

    Hey @Paul when you have time, check this out. I know you don't plan on tackling this until next year, but I think it'd be a good idea to throw around some user experience ideas on how volumetric rendering for radar data will be visualized, managed and navigated. Give this neat little demo from MapTiler: https://www.maptiler.com/tools/weather/3d/#7.95/23.861/54.939/-7.8/60

    It has a pretty intuitive method with the UX on how you adjust the DBz the view box, I wonder if this kind of approach may be possible when it comes time to build the volumetric rendering feature? I like how easily you can easily slide the X, Y and Z axis in this demo. Let me know what you think!

      eliteo Very surprised I have not seen this. This company is definitely competitive. That is the best web browser GPU vector mapping I have seen to date, better than MapBox. It's the first time I've seen volume rendering for radar data in browser.

      I can do much better on desktop with native performance in many areas, but the mapping is excellent on that product for a web browser. The volume rendering is actually the part I find least impressive compared to everything else there. They are doing the vertical stacks of 2D texture slices - we need to have arbitrary flying/rotating 3D camera view unlike the cut-down camera controls there understandably for the browser demo. I intend to have a better volume rendering algorithm than used there, probably with dynamic resolution raycasting, but R&D on this isn't until next year. This is because everything else needs to be optimized first to leave the most GPU rasterization/compute budget for VR, which is the most GPU-heavy system planned.

      The 3D terrain engine in WSV3 Tactical Mesoanalyst also adds more complexity to the interplay with radar data volumetric rendering. That site uses a 2D flat surface, but I intend to make everything true to spherical elevation if possible. If that adds much complexity I could constrain volume rendering to 3D flat sphere (globe but flat terrain) to start.

      What will be most unique about WSV3 is if I can operationalize real-time bandwidth-optimized radar reflectivity volume rendering with the client-server infrastructure. That link shows a historical 2019 dataset. There are many aspects for me to improve on, but I am definitely impressed by that WebGL site as a graphics programmer.

        Paul It's something I just recently found it myself when I was just searching around for some cool resources on volumetric radar imaging. 🙂 It's very impressive even for it being on the browser! I figured you'd like this cool little demo.

        Yeah I was thinking about that earlier with the 3D terrain engine. I can definitely see that adding complexity with rendering volumetric radar data and placement of data. I think MAX has 3D terrain capabilities, but I'm not sure if the terrain flattens when it's in volume scanner mode or not, I'm pretty sure it just stays, because WXIX in Cincinnati uses MAX and when they used 3D mode last week for Beryl's remnants, I could see the hills cut off some of the roads. When I have time, I'll have to dig around on their video documentation they have out to see for sure, but I think they just keep the 3D terrain in volumetric mode, drape the 2D radar image along that surface and then elevate the plain where the 3D volumetric rendering is generated from, and generate the volume from there, if that makes sense.

        @Paul Here's another cool example I found: https://radar.quadweather.com/

        You'll need to make a free account to view live radar data. It's set up kind of like how Radar Omega has their volume rendering feature set up. But in the case that the 3D terrain makes it too difficult to project volumetric data over and adjust with terrain height, this could be another method: drawing a box that opens like a dual panel with the original radar imagery on the right or left, and then the volume display being on the other side.

        Also, I lost the link to it, but I found a really cool online 3D map that rendered wind particles using weather model data from the GFS, NAM, etc. Once I find that, I'll share that link as well!

          5 days later

          Paul Nowadays, there's Web Assembly (Wasm) that allows a considerable (and growing) number of systems languages to be compiled to it and then rendered to the web. Hell, if I recall, AutoCAD and several others now have a browser version or have entirely switched to in-browser SaaS.

          MeteoLatvia Real-time particle stream rendering of vector field raster parameters is considered a basic essential release requirement. I am now switching back to 2D for the time being to implement the core raster data display and composition engine, where this ability will be first developed.

            Paul The entire development process and the to-do list is evolving so fast I can't even catch up. 😃 Either way - just sent these URL's FYI.

            Speaking of 2D mode - I thought that it would be very nice if we could select map projection. The PlateCarree/Geographic projection seems to be the default one which is used in most software as 2D map mode:

            But the chance to switch to e.g. Mercator, Orthographic, Stereographic etc. projections could be nice tool to have, especially because sometimes you have things happening far North (e.g. Polar Vortex) and then you would like to have different map projection aside 3D.

            Mercator:

            Orthographic:

            Stereographic:

            • Paul replied to this.

              MeteoLatvia These might be great future developments for specific industry products, but for the main Tactical Mesoanalyst offering with specialization in real-time weather display, I decided it is suboptimal to offer a variety of projections as opposed to optimizing everything around one solid mapping projection logic which is suited to the task of the human mesoanalyst with focus over 80 +/- degrees latitude from the equator. This simplifies and empowers the programming, and allows for many optimizations. The bandwidth and performance optimization of the quality display of raw data must be the foremost concern. Introducing extra complexity isn't currently needed as long as the 2D flat/3D sphere switch map modes succeed in providing the user a reliable display of most important datasets.

              14 days later

              MeteoLatvia I am dealing with custom projection code (for ingest, not for output rendering) right now which caused me to think of your post, and I want to clarify my response from 2 weeks ago. Only for the initial December 2025 release have I very surely decided it is optimal to only have A) 2D lat/lon equirectangular map and B) 3D map. Eventually in the future, developing additional rendering output map projections could be a viable theoretical target, especially for the polar stereographic case, where the initial release will not support polar data. My Data Oriented Design philosophy commands me to optimize for the common case. Right now, with the current user-base, that is 99.9% CONUS-only - even the intended global mapping scope is beyond the current average-user common case. I mean to say that the coolest, most useful, most impressive product possible to create by the date of 12/13/25 requires the most simplifications in this area, so I can focus on the content itself first. Eventually everything that is possible and relevant to purpose is on the table. It has been an exercise in wisdom to omit work as much as to plan it. I have to be tactical about my development itself in order to deliver the maximum value by the stated deadline. Thankfully I will likely remain on the project started September 2023 thereafter for the rest of my life. I will reflect on the next 16 months wishing, if anything, I spent more time perfecting a smaller subset of actually useful, novel capabilities for the real-time storm tracking purpose.

              2 months later

              @Paul I finally found the link to the 3D wind-fleas map I found a while back; now be prepared, it'll use some browser resources.. my laptop's fan kinda goes crazy after a few minutes being on this page lol. But check it out real quick when you have time! https://cici.lab.asu.edu/polarglobe/ Idk if this could be done later on down the road in WSV3-TM or not? I don't think even the broadcast/commercial workstations have this capability.

              • Paul replied to this.

                eliteo That's just animated vector field particle/streamline rendering, which is confirmed for WSV3 Tactical Mesoanalyst. I consider that a basic necessity. The one unique thing that site is doing is giving you a 3D particle visualization of different vertical levels of vector field data. I can eventually do that and already thought about it. There are some fascinating concepts of mixing radar velocity and NWP data for this.

                Single-level 2D/3D particle stream visualization similar to that site is expected with high confidence for the December 2025 release.